Hanes–Woolf plot
Hanes–Woolf plot
Jump to navigation
Jump to search
Hanes–Woolf plot
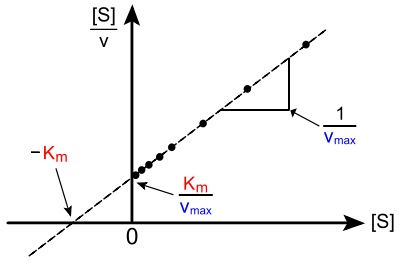
In biochemistry, a Hanes–Woolf plot is a graphical representation of enzyme kinetics in which the ratio of the initial substrate concentration [S] to the reaction velocity v is plotted against [S]. It is based on the rearrangement of the Michaelis–Menten equation shown below:
- [S]v=[S]Vmax+KmVmax{displaystyle {[S] over v}={[S] over V_{max }}+{K_{m} over V_{max }}}
![{[S] over v}={[S] over V_{max }}+{K_{m} over V_{max }}](https://wikimedia.org/api/rest_v1/media/math/render/svg/6cfabea4f5fe6b4c2e6533f824b5f15aefc18218)
where Km is the Michaelis–Menten constant and Vmax is the maximum reaction velocity.
J B S Haldane stated that this method was due to Barnet Woolf.[1] It was also used by Charles Samuel Hanes, even though he neither mentions nor cites Woolf.[2] Hanes pointed out that the use of linear regression to determine kinetic parameters from this type of linear transformation is flawed, because it generates the best fit between observed and calculated values of 1/v, rather than v.
The equation can be derived from the Michaelis–Menten equation as follows:
- v=Vmax[S]Km+[S]{displaystyle v={{V_{max }[S]} over {K_{m}+[S]}}}
![v={{V_{{max }}[S]} over {K_{m}+[S]}}](https://wikimedia.org/api/rest_v1/media/math/render/svg/894c0d8d1c3e9feaf46e8d0f89ae8b7a5cdfc501)
invert and multiply by [S]:
- [S]v=[S](Km+[S])Vmax[S]=Km+[S]Vmax{displaystyle {[S] over v}={{[S](K_{m}+[S])} over {V_{max }[S]}}={{K_{m}+[S]} over {V_{max }}}}
![{[S] over v}={{[S](K_{m}+[S])} over {V_{{max }}[S]}}={{K_{m}+[S]} over {V_{max }}}](https://wikimedia.org/api/rest_v1/media/math/render/svg/68233dfb6d5bc6c3fd52e849e5eb2a46e9e0edda)
Rearrange:
- [S]v=1Vmax[S]+KmVmax{displaystyle {[S] over v}={1 over V_{max }}[S]+{K_{m} over V_{max }}}
![{[S] over v}={1 over V_{max }}[S]+{K_{m} over V_{max }}](https://wikimedia.org/api/rest_v1/media/math/render/svg/3bb781047fcb26179df1b93d6d8c0cde115a59b4)
As is clear from the equation, perfect data will yield a straight line of slope 1/Vmax, a y-intercept of Km/Vmax and an x-intercept of −Km.
Like other techniques that linearize the Michaelis–Menten equation, the Hanes–Woolf plot was used historically for rapid determination of the important kinetic parameters Km, Vmax and Vmax/Km, but it has been superseded by nonlinear regression methods that are significantly more accurate and no longer computationally inaccessible. It remains useful, however, as a means to present data graphically.
One drawback of the Hanes–Woolf approach is that neither ordinate nor abscissa represent independent variables: both are dependent on substrate concentration. As a result, the typical measure of goodness of fit, the correlation coefficient R, is not applicable.
See also[edit]
- Michaelis–Menten kinetics
- Lineweaver–Burk plot
- Eadie–Hofstee diagram
References[edit]
^ Haldane, J. B. S. (20 April 1957). "Graphical Methods in Enzyme Chemistry". Nature. 179 (832). doi:10.1038/179832b0..mw-parser-output cite.citation{font-style:inherit}.mw-parser-output q{quotes:"""""""'""'"}.mw-parser-output code.cs1-code{color:inherit;background:inherit;border:inherit;padding:inherit}.mw-parser-output .cs1-lock-free a{background:url("//upload.wikimedia.org/wikipedia/commons/thumb/6/65/Lock-green.svg/9px-Lock-green.svg.png")no-repeat;background-position:right .1em center}.mw-parser-output .cs1-lock-limited a,.mw-parser-output .cs1-lock-registration a{background:url("//upload.wikimedia.org/wikipedia/commons/thumb/d/d6/Lock-gray-alt-2.svg/9px-Lock-gray-alt-2.svg.png")no-repeat;background-position:right .1em center}.mw-parser-output .cs1-lock-subscription a{background:url("//upload.wikimedia.org/wikipedia/commons/thumb/a/aa/Lock-red-alt-2.svg/9px-Lock-red-alt-2.svg.png")no-repeat;background-position:right .1em center}.mw-parser-output .cs1-subscription,.mw-parser-output .cs1-registration{color:#555}.mw-parser-output .cs1-subscription span,.mw-parser-output .cs1-registration span{border-bottom:1px dotted;cursor:help}.mw-parser-output .cs1-hidden-error{display:none;font-size:100%}.mw-parser-output .cs1-visible-error{font-size:100%}.mw-parser-output .cs1-subscription,.mw-parser-output .cs1-registration,.mw-parser-output .cs1-format{font-size:95%}.mw-parser-output .cs1-kern-left,.mw-parser-output .cs1-kern-wl-left{padding-left:0.2em}.mw-parser-output .cs1-kern-right,.mw-parser-output .cs1-kern-wl-right{padding-right:0.2em}
^ Hanes, CS (1932). "Studies on plant amylases: The effect of starch concentration upon the velocity of hydrolysis by the amylase of germinated barley". Biochemical Journal. 26 (5): 1406–1421. PMC 1261052. PMID 16744959.
Categories:
- Plots (graphics)
- Enzyme kinetics
(window.RLQ=window.RLQ||).push(function(){mw.config.set({"wgPageParseReport":{"limitreport":{"cputime":"0.108","walltime":"0.174","ppvisitednodes":{"value":247,"limit":1000000},"ppgeneratednodes":{"value":0,"limit":1500000},"postexpandincludesize":{"value":14044,"limit":2097152},"templateargumentsize":{"value":82,"limit":2097152},"expansiondepth":{"value":7,"limit":40},"expensivefunctioncount":{"value":2,"limit":500},"unstrip-depth":{"value":1,"limit":20},"unstrip-size":{"value":5858,"limit":5000000},"entityaccesscount":{"value":2,"limit":400},"timingprofile":["100.00% 107.294 1 -total"," 87.23% 93.596 1 Template:Reflist"," 78.29% 84.000 2 Template:Cite_journal"," 12.71% 13.638 1 Template:Enzymes"," 10.39% 11.146 1 Template:Navbox"," 1.94% 2.079 1 Template:Main_other"]},"scribunto":{"limitreport-timeusage":{"value":"0.062","limit":"10.000"},"limitreport-memusage":{"value":2219361,"limit":52428800}},"cachereport":{"origin":"mw1332","timestamp":"20181023212355","ttl":1900800,"transientcontent":false}}});mw.config.set({"wgBackendResponseTime":274,"wgHostname":"mw1332"});});

 Clash Royale CLAN TAG

